Part of the work of the Platform Services team at Alfresco is around deployment, specifically Kubernetes.
Monitoring a Kubernetes (K8s) cluster is critical in production and there are many great tools out there like Prometheus and Grafana, but I wanted to ‘play’ with getting K8s metrics into the Elasticsearch, Logstash, and Kibana (ELK) stack, all deployed in my local Docker Desktop Kubernetes environment.
I found several resources on various parts of the solution, but didn’t find one that tied all of it together, so hopefully this post will be of use to someone.
Prerequisites
1. Deploy the ELK Stack
Helm provides excellent package management of K8s and is always my first choice for deployment so I started there for the ELK stack, and sure enough, there’s a Helm chart for that (elastic-stack).
You can easily override/merge the default values of a chart with your own values file so I created one that enabled filebeat and pointed it to logstash and the elasticsearch client and pointed logstash to the elasticsearch client:
my-elastic-stack.yaml:
logstash:
  enabled: true
  elasticsearch:
    host: elastic-stack-elasticsearch-client

filebeat:
  enabled: true
  config:
    output.file.enabled: false
    output.logstash:
      hosts: ["elastic-stack-logstash:5044"]
  indexTemplateLoad:
    - elastic-stack-elasticsearch-client:9200
Then deployed with those values:
helm install --name elastic-stack stable/elastic-stack -f ~/Desktop/my-elastic-stack.yaml
You’ll see some output detailing what you’ve deployed and you can check the status of the pods with kubectl:
kubectl get pods -l "release=elastic-stack"
2. Port Forward Kibana and Setup Index
Once the pods are all showing proper READY status (which may take a minute or two) you can set up port forwarding to the Kibana pod:
export POD_NAME=$(kubectl get pods --namespace default -l "app=kibana,release=elastic-stack" -o jsonpath="{.items[0].metadata.name}");
kubectl port-forward --namespace default $POD_NAME 5601:5601
Then open http://127.0.0.1:5601 in your browser to access the Kibana UI.
You can then of course create an index pattern for filebeat and browse those entries:
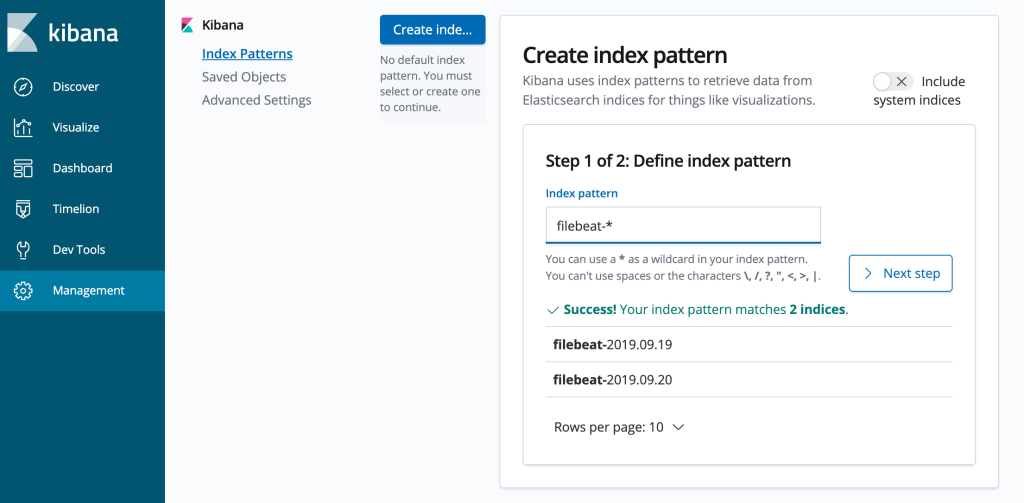
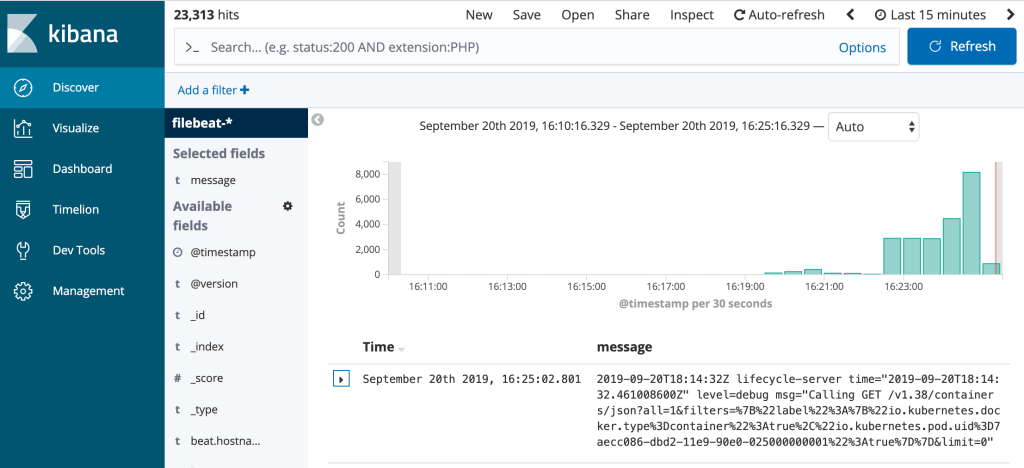
3. Deploy kube-state-metrics
The elastic metricbeat module (which we’ll deploy in a moment) relies on kube-state-metrics. Sure enough, there’s a chart for that (kube-state-metrics):
helm install --name kube-state-metrics stable/kube-state-metrics
4. Deploy Metricbeat
Metricbeat collects (easy guess) metrics and, through its Kubenetes modules, can get data from K8s nodes and the API. Sure enough, (you know where this is going…) there’s a chart for that (metricbeat).
In this case we have to override values to:
- Use the open source version of the metricbeat Docker image (metricbeat-oss)
- Point the daemonset Kubernetes module to the proper K8s SSL metrics host (and disable SSL verification)
- Point the deployment to the elasticsearch client and kibana in the cluster
my-elastic-metricbeat.yaml
image:
  repository: docker.elastic.co/beats/metricbeat-oss
daemonset:
  config:
    output.file:
    output.elasticsearch:
      hosts: ["elastic-stack-elasticsearch-client:9200"]
  modules:
    kubernetes:
      config:
        - module: kubernetes
          metricsets:
            - node
            - system
            - pod
            - container
            - volume
          period: 10s
          host: ${NODE_NAME}
          hosts: ["https://${HOSTNAME}:10250"]
          bearer_token_file: /var/run/secrets/kubernetes.io/serviceaccount/token
          ssl.verification_mode: "none"
deployment:
  config:
    output.file:
    output.elasticsearch:
      hosts: ["elastic-stack-elasticsearch-client:9200"]
    setup.kibana:
      host: "elastic-stack-kibana:443"
    setup.dashboards.enabled: true
Then deploy with those values:
helm install --name elastic-metricbeat stable/metricbeat -f ~/Desktop/my-elastic-metricbeat.yaml
5. Setup Metricbeat Index and K8s Dashboard
Metricbeat will start feeding the K8s metrics to Elasticsearch and should setup another index pattern and load several dashboards into Kibana.
You can then open the [Metricbeat Kubernetes] Overview dashboard:
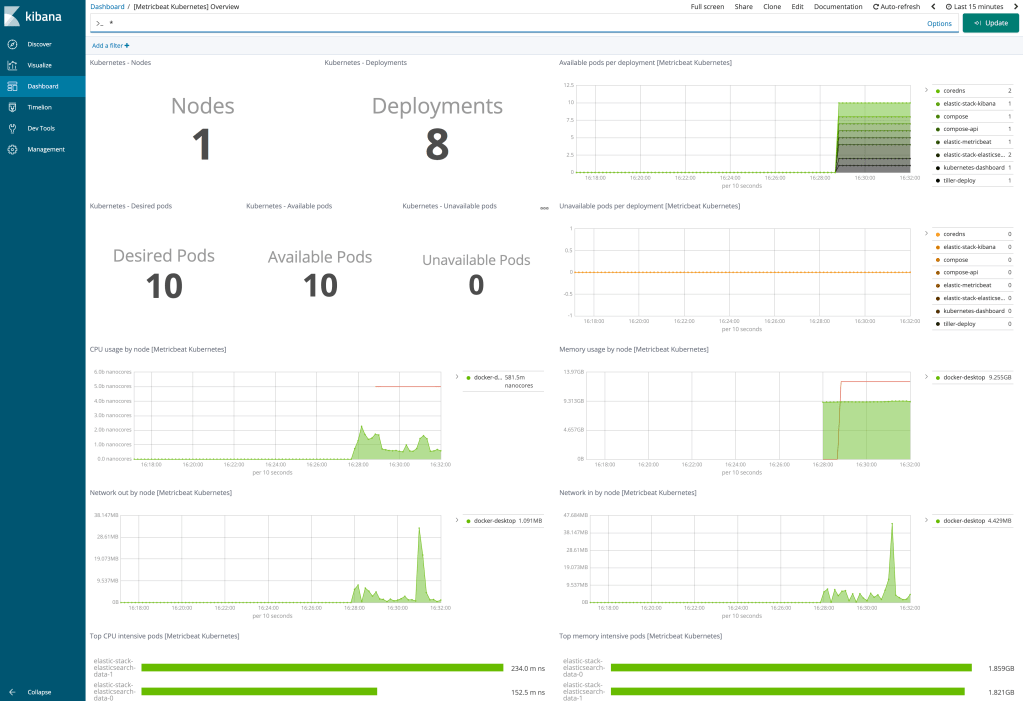
Of course, there are lots ways this could be done, and this could all be easily tied together in a parent Helm chart for easier release management.
Tools like Prometheus and Grafana may be targeted more specifically for this sort of task out of the box, but it’s great to see the Elastic stack as another viable option.
Are any of you using the ELK stack for K8s monitoring in production?

for metricbeat, turn output.file off to make it work ie.:
image:
repository: docker.elastic.co/beats/metricbeat-oss
daemonset:
config:
output.file: false
output.elasticsearch:
hosts: [“elastic-stack-elasticsearch-client:9200”]
modules:
kubernetes:
config:
– module: kubernetes
metricsets:
– node
– system
– pod
– container
– volume
period: 10s
host: ${NODE_NAME}
hosts: [“https://${HOSTNAME}:10250”]
bearer_token_file: /var/run/secrets/kubernetes.io/serviceaccount/token
ssl.verification_mode: “none”
deployment:
config:
output.file: false
output.elasticsearch:
hosts: [“elastic-stack-elasticsearch-client:9200”]
setup.kibana:
host: “elastic-stack-kibana:443”
setup.dashboards.enabled: true
Hi mazrc, thanks for the feedback.
The empty values above worked for me, but perhaps things are different in your environment or the chart has changed.