Adding Document Library Views to Alfresco Share

Overview

In this post we’ll go through how to develop and deploy additional view types beyond the default simple and detailed views in the document library in Share.

The techniques here require Alfresco 4.0.2 or later, or a recent checkout of community HEAD.

The Document Library Component

We won’t go into all the details on how the document library is rendered but it’s a fairly standard webscript-based component with ‘server-side’ resources like FreeMarker files for HTML fragments, Javascript for manipulating the data model, and localization properties files, and ‘client-side’ resources sent to the browser like CSS and Javascript.

While adding a document library view will involve changes to both client-side and server-side tiers, most of our notable changes will be to client-side Javascript files sent to the browser. The server-side webscripts changes are primarily to load and instantiate the client-side objects.

The component we’re interested in is at:
alfresco/site-webscripts/org/alfresco/components/documentlibrary/documentlist.*

and note that within that directory resources from include/documentlist.* are included by some of the primary files.

DocumentList and DocumentListViewRenderer

The DocumentList Javascript object makes up the bulk of the document library view and is defined in the client-side documentlist.js file along with event handler methods and other display setup. The DocumentList object sets up a YUI DataTable which handles most of the work of AJAX calls, pagination, etc.

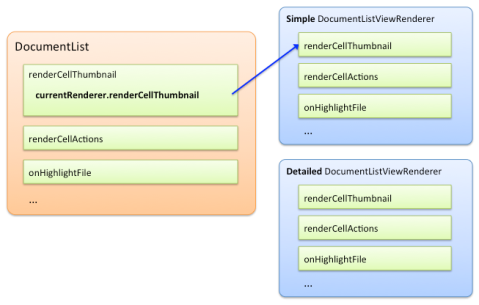
Each column in the DataTable is assigned a method which dictates how to render that column given the data row.  For example, the DataTable calls DocumentList.fnRenderCellThumbnail for the ‘thumbnail’ column of each row it renders.

The DocumentList also contains a set of registered DocumentListViewRenderers, ‘simple‘ and ‘detailed‘ by default, which do the work of generating the HTML for their view type. In other words, DocumentList.fnRenderCellThumbnail actually determines the current view renderer based on the current viewRendererName and hands off its work to DocumentListViewRenderer.renderCellThumbnail.

This allows developers to create their own objects which extend and override the DocumentListViewRenderer with methods for their specific needs.

For this example our goal will be to add a view which is very similar to the existing detail view but with larger thumbnails.

Steps to Add a View

Define the View

For a new view we need to define a new DocumentListViewRenderer object.  That customization could be just a new instance of the base DocumentListViewRenderer with a different name so that alternate CSS is applied and metadata rendered.

The name of the view renderer specified in the constructor is used for CSS class names among other things so a simple example of adding a second detailed view with a larger thumbnail might look like:

new Alfresco.DocumentListViewRenderer("large");

In more complex scenarios you probably want to extend DocumentListViewRenderer in a client-side documentlist-custom.js file, which is what we’ll do in this example.

First we want to define a constructor:

Alfresco.DocumentListLargeViewRenderer = function(name)
{
   Alfresco.DocumentListLargeViewRenderer.superclass.constructor.call(this, name);
   // Defaults to large but we'll copy the metadata from detailed view
   this.metadataBannerViewName = "detailed";
   this.metadataLineViewName = "detailed";
   this.thumbnailColumnWidth = 200;
   return this;
};

then make it extend from DocumentListViewRenderer:

YAHOO.extend(Alfresco.DocumentListLargeViewRenderer, Alfresco.DocumentListViewRenderer);

and we’ll override the renderCellThumbnail method with almost the same code in the detail view, but adding a documents-large CSS class to the thumbnail container and changing the call to generateThumbnailUrl to use the imgpreview thumbnail definition:

Alfresco.DocumentList.generateThumbnailUrl(record, 'imgpreview')

(Full code)

Register the View

Once the view renderer has been defined it needs to be registered with the DocumentList object via its registerViewRenderer method.  This needs to be done after the DocumentList object has been created and setup, so a good place to perform the registration is after the YUI Bubbling Event postSetupViewRenderers has fired.  To register the same view above:

YAHOO.Bubbling.subscribe("postSetupViewRenderers", function(layer, args) {
   var scope = args[1].scope;
   var largeViewRenderer = new Alfresco.DocumentListLargeViewRenderer("large");
   scope.registerViewRenderer(largeViewRenderer);
});
Accessing the View

The user has to be able to navigate to this new view and even though we’ve registered it, the DocumentList needs to know which view renderers are enabled and in what order, both of which are defined in the DocumentList’s options under viewRendererNames.  We can add our custom view above to the server-side FreeMarker model:

model.viewRendererNames.push("large");

Note that the name here must match the name of the view renderer constructor.

Not only does this define that the ‘large‘ view is enabled, the navigation buttons are also rendered from this viewRendererNames list, so we’ve taken care of the interface as well.

CSS

Our overridden renderCellThumbnail method above adds the documents-large CSS class so we’ll need to define that, as well as the display of the view selection button. Here’s a portion of the documentlist-custom.css file:

.doclist .thumbnail.documents-large {
	height: 200px !important;
	width: 200px !important;
}
.doclist .thumbnail.documents-large img {
    max-width: 280px;
}

Packaging

There are of course a number of ways this code could be packaged and deployed but this type of customization lends itself particularly well to a share extensibility module which Erik Winlöf and David Draper have blogged about in detail.  We’ll assume a standard Maven or Gradle Java project layout for the code, and to keep things simple the example deploys as a Share jar rather than an AMP.

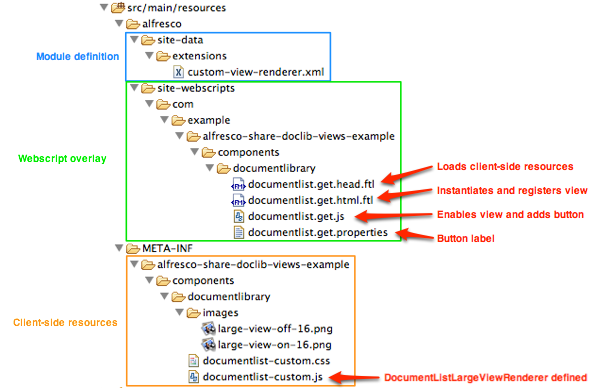
Server-side Resources

We need to define the customization itself:

src/main/resources/alfresco/site-data/extensions/custom-view-renderer.xml

<extension>
    <modules>

        <module>
            <id>Example :: Document List Custom View</id>
            <auto-deploy>true</auto-deploy>
            <customizations>
                <customization>
                    <targetPackageRoot>org.alfresco</targetPackageRoot>
                    <sourcePackageRoot>com.example.alfresco-share-doclib-views-example</sourcePackageRoot>
                </customization>
            </customizations>
        </module>

    </modules>
</extension>

We could place the javascript which creates the new view renderer a number of places, even purely client-side, but as we’ll see in another post it can be handy to have access to the FreeMarker data model so we’ll place it in:

src/main/resources/alfresco/site-webscripts/com/example/alfresco-share-doclib-views-example/components/documentlibrary/documentlist.get.html.ftl

Note that the the wrapping <@markup> directive there indicates that we want to inject the Javascript after documentListContainer.

We’ll place the server-side webscript javascript which enables the view at:

src/main/resources/alfresco/site-webscripts/com/example/alfresco-share-doclib-views-example/components/documentlibrary/documentlist.get.js

which will get its label from the localization file at:
src/main/resources/alfresco/site-webscripts/com/example/alfresco-share-doclib-views-example/components/documentlibrary/documentlist.get.properties

Client-side Resources

For including client-side CSS, Javascript, and image resources in a jar we’ll place them in the META-INF dir at:
src/main/resources/META-INF/alfresco-share-doclib-views-example/components/documentlibrary/*

So at this point src/main/resources should look like:

Package that as jar or AMP and deploy to your Share instance.

Results

The next time you go to a site’s document library you should see the additional
button for your view and the larger thumbnails:

Since we implemented this as a standard extensibility module you can completely disable it by going to your Share deployment’s module management page at something like http://localhost:8080/share/page/modules/deploy and disable the module.

What’s Next?

I’ll go into more advanced customizations in future posts, but in the meantime, what kind of doclib view are you going to build?
MyFaces Tomahawk and the HTML BASE Tag

This one incited a bit of facepalm.

When trying to changing part of RightsPro‘s header implementation to use the HTML BASE tag the element seemed to be ignored completely and resource references were still relative to the page URL.  The tag was present, correct, and closed, but having no affect.

It turns out the BASE tag must appear ‘before any element that refers to an external source’ but MyFaces Tomahawk adds any script references needed immediately after the opening HEAD tag, rendering the BASE tag useless.

I don’t have time to modify the Tomahawk source at the moment for a proper fix but did submit a bug.

As a workaround you can put the BASE tag above the head element. It’s not valid HTML but most browsers will still obey it and render the page properly.

A short post, but it may save a few precious hairs from being pulled out. I’ll update if and when the bug is resolved.

JasperReports XML Datasource with Inline Images

We’re adding XML datasources for reports in RightsPro (currently JasperReports is supported) and needed to embed the image data directly in the XML so thought I’d expand on the solution I found here.

If your creating your XML dynamically using Java you can do:

...
import org.apache.commons.codec.binary.Base64;

// Read the byte array from DB or whatever
byte[] imageByteArray = getImageByteArray();

String base64Image = Base64.encodeBase64String(imageByteArray);

...

then write the Base64 encoded data in your XML as:

...

<image><![CDATA[ ... Base64 mess here ... ]]></image>

...

The rest comes from this JasperForge forum post which explains how to decode the Base64 into a ByteArrayInputStream that’s usable by the JasperReports image report element.

As the post says, in your JasperReport (we currently use iReport as a report editor) define a String field, let’s call it Image, for the image:

then define a variable, let’s call it ImageBytes, which uses that field:

with the Variable Expression:

new ByteArrayInputStream(new Base64().decodeBase64($F{Image}.getBytes("UTF-8")))

(don’t forget to add org.apache.commons.codec.binary.Base64 to the imports of the report properties)

and in the image element on your layout use the ImageBytes variable:

and you should see your image properly rendered in the final report.

However, what I found at this point is that while the images displayed fine in iReport in PDF preview most PDF readers were unable to display the images, resulting in just a black rectangle.

The solution was to change the ImageBytes variable class to java.awt.Image with a constructor of:

ImageIO.read(new ByteArrayInputStream(new Base64().decodeBase64($F{Image}.getBytes("UTF-8"))))

then change the expression class of the image element on the layout to java.awt.Image as well. You’ll also have to add javax.imageio.ImageIO to the imports of the report.

This technique can be useful when you need to grab the image data dynamically (not from actual files on the filesystem), you can’t get each image from a URL (perhaps due to security constraints), and don’t want to use a custom Java datasource.

Growing jQuery Progress Bars

At RightsPro, we’ve chosen to go with jQuery UI as an interface framework and while the progress bars look great out of the box we wanted to add the effect of the progress growing to its value when the user visits the page to draw attention to it.

jQuery’s documentation for the UI components, including the progress bar, is straight forward.

Once you’ve included the proper javascript files and created the progress div a simple javascript command adds the appropriate classes and creates the progress bar:


$(function() {
$("#progressbar").progressbar({
value: 37
});
});

but to add the growing animation effect we initially set the value to 0 then animate the width of the progress bar value div created by jQuery’s javascript:


$(function() {
$("#progressbar").progressbar({
value: 0
});
$("#progressbar > .ui-progressbar-value").animate({
width: "37%"
}, 500);
});

where 500 is the time the animation should take in milliseconds.

This gives the desired effect of the progress bar growing to its value when the page loads rather than immediately rendering the final result.

Not earth-shattering, but a nice little trick.

Web-Based Line Chart Tools Comparison

chart-users-flot
Flot/jQuery

chart-users-yui
YUI
chart-users-google
Google Visualization API

I’m in the process of evaluating various AJAX/DHTML frameworks for an enterprise application and one of the needs that deserved some hands-on experimentation was the ability create charts.

jQuery and YUI are in the lead as far as core frameworks for this application and the Google Visualization API seems pretty interesting so was included as well.

As a fairly simple and common use case I choose a target of a line chart that showed the number of users of a few services over time and defined some basic requirements:

  • The data must be fetched from a separate URL, not defined on the presentation page (this URL will be a web service in production)
  • Three series must be displayed at once
  • The data points should have tooltips
  • ‘Out-of-the-box’ components should be used when possible
  • A non-flash solution is preferred

Some of the points I found interesting from each framework follow. Note that the charts here are only screenshots as I didn’t find any immediately obvious way to get the real charts working on wordpress.com.

Flot/jQuery

chart-users-flot

At this time it doesn’t seem that jQuery or jQuery UI has any built-in charting abilities but there are a ton of community plugins available.

Flot looked the most promising (Sparklines also looks very good for tiny charts).

Data

Flot seems to prefer its data in JSON format organized by series and we want to simulate a web service so we’ll create a file data/users-series-format.json containing something like:

[
{label: "Service 1 Users", data:[
...
[1241668800000,110],
[1241755200000,115]
]},
{label: "Service 2 Users", data:[
...
[1241668800000,22],
[1241755200000,23]
]},
{label: "Service 3 Users", data:[
...
[1241668800000,26],
[1241755200000,31]
]}
]

Presentation

Setup was simple enough.  Include the scripts:

<!--[if IE]><script language="javascript" type="text/javascript" src="../excanvas.pack.js"></script><![endif]-->

<script language="javascript" type="text/javascript" src="scripts/jquery/jquery-1.3.2.js"></script>

<script language="javascript" type="text/javascript" src="scripts/jquery/jquery.flot.js"></script>

put in the placeholder where you want the chart:

<div id="placeholder" style="width:400px; height:200px;"></div>

get the data and build the chart:

<script id="source" language="javascript" type="text/javascript">

$.getJSON("data/users-series-format.json", function(json){

$.plot($("#placeholder"), json, {

xaxis: { mode: "time" },

lines: { show: true },

points: { show: true }

});

});

</script>

Adding the tooltip was a little more complicated but not terribly so.

YUI

chart-users-yui

The Yahoo! User Interface Library (YUI) is a mature, robust library with Yahoo-supplied components for just about everything.

The YUI Charts Control (labeled as experimental at the time of this writing) creates nice looking charts, but they are flash-based.

There is plenty of documentation on YUI’s charts so I won’t go into too much detail but the concepts are similar to above.

Data

YUI’s DataSource component can handle several data formats, for consistency’s sake I went with JSON so my file data/users-raw-format.json (named so since it most closely resembles the raw data used to build it) contains:

{"Response" : { "Results" : [
...
{"date":"5/7/09","Service_1_Users":110},
{"date":"5/7/09","Service_2_Users":26},
{"date":"5/7/09","Service_3_Users":22},
{"date":"5/8/09","Service_1_Users":115},
{"date":"5/8/09","Service_2_Users":31},
{"date":"5/8/09","Service_3_Users":23}
]}}

I did have trouble getting this data to load properly via URL when the HTML file containing the DataSource code was loaded in the browser via file:// rather than http:// even after adding the file location to the Flash global security settings.

The chart also displayed oddly when the data contained JavaScript timestamps and a date parser was used, so as you can see a string date was used in the data, not ideal but this is just proof of concept.

Presentation

Include the scripts (YUI’s dependency configurator comes in handy here), add a place holder div for the chart, get the data, and build the chart.

Don’t forget to set YAHOO.widget.Chart.SWFURL to a location containing the swf.

Google Visualization API

chart-users-google

There are some pretty slick examples in the Google’s Visualization Gallery like the Motion Chart, but for the purposes of our exploring we just need the Line Chart.

Once again we have a similar pattern for getting things running.

Data

Google requires that the web service providing the data source implement a particular protocol and format.

We’ll again use JSON and with Google’s format our data/users-google-format.json file looks like:

google.visualization.Query.setResponse({
version:'0.6',
reqId:'0',
status:'ok',
sig:'5982206968295329967',
table:{
cols:[
{id:'date',label:'Date',type:'date'},
{id:'s1',label:'Service 1 Users',type:'number'},
{id:'s2',label:'Service 2 Users',type:'number'},
{id:'s3',label:'Service 3 Users',type:'number'}],
rows:[
...
{c:[{v:new Date(2009,4,7,0,0,0)},{v:110},{v:26},{v:22}]},
{c:[{v:new Date(2009,4,8,0,0,0)},{v:115},{v:31},{v:23}]}
]
}
});

At first the format seemed cumbersome but I realize that many users would prefer this close resemblance to how the same data would appear in a spreadsheet.

Presentation

Loading of the scripts is a little different since you use Google’s core JavaScript API to load the charting tools needed and can call the chart initialization on successful load of that package:

<script type=“text/javascript” src=http://www.google.com/jsapi&#8221;></script>

<script type=“text/javascript”>

google.load(“visualization”, “1”, {packages:[“linechart”]});

google.setOnLoadCallback(initialize);

where initialize loads the data:

function initialize() {

var query = new google.visualization.Query(‘data/users-google-format.json’);

query.send(handleQueryResponse);

}

and the query calls handleQueryResponse which draws the chart:

function handleQueryResponse(response) {

if (response.isError()) {

alert(‘Error in query: ‘ + response.getMessage() + ‘ ‘ + response.getDetailedMessage());

return;

}

var data = response.getDataTable();

var chart = new google.visualization.LineChart(document.getElementById(‘chart_div’));

chart.draw(data, {width: 400, height: 200, is3D: true});

}

</script>

Summary

Even with the extensive documentation and examples available on YUI I’d have to say it was the most difficult to deal with, presenting some little problem at almost every turn.

It didn’t seem that it would be very easy to use a JSON format other than the one recommended by the framework for any of the tools evaluated, which is disappointing.

There are certainly a lot of factors to consider before choosing a UI framework, but if all I needed were line charts I’d probably hand it to Flot/jQuery.